What is planogram compliance, and why does it matter for category growth?
The gap between the planned shelf and the actual shelf is the cheapest category growth available to brands and retailers.
20 August 2026
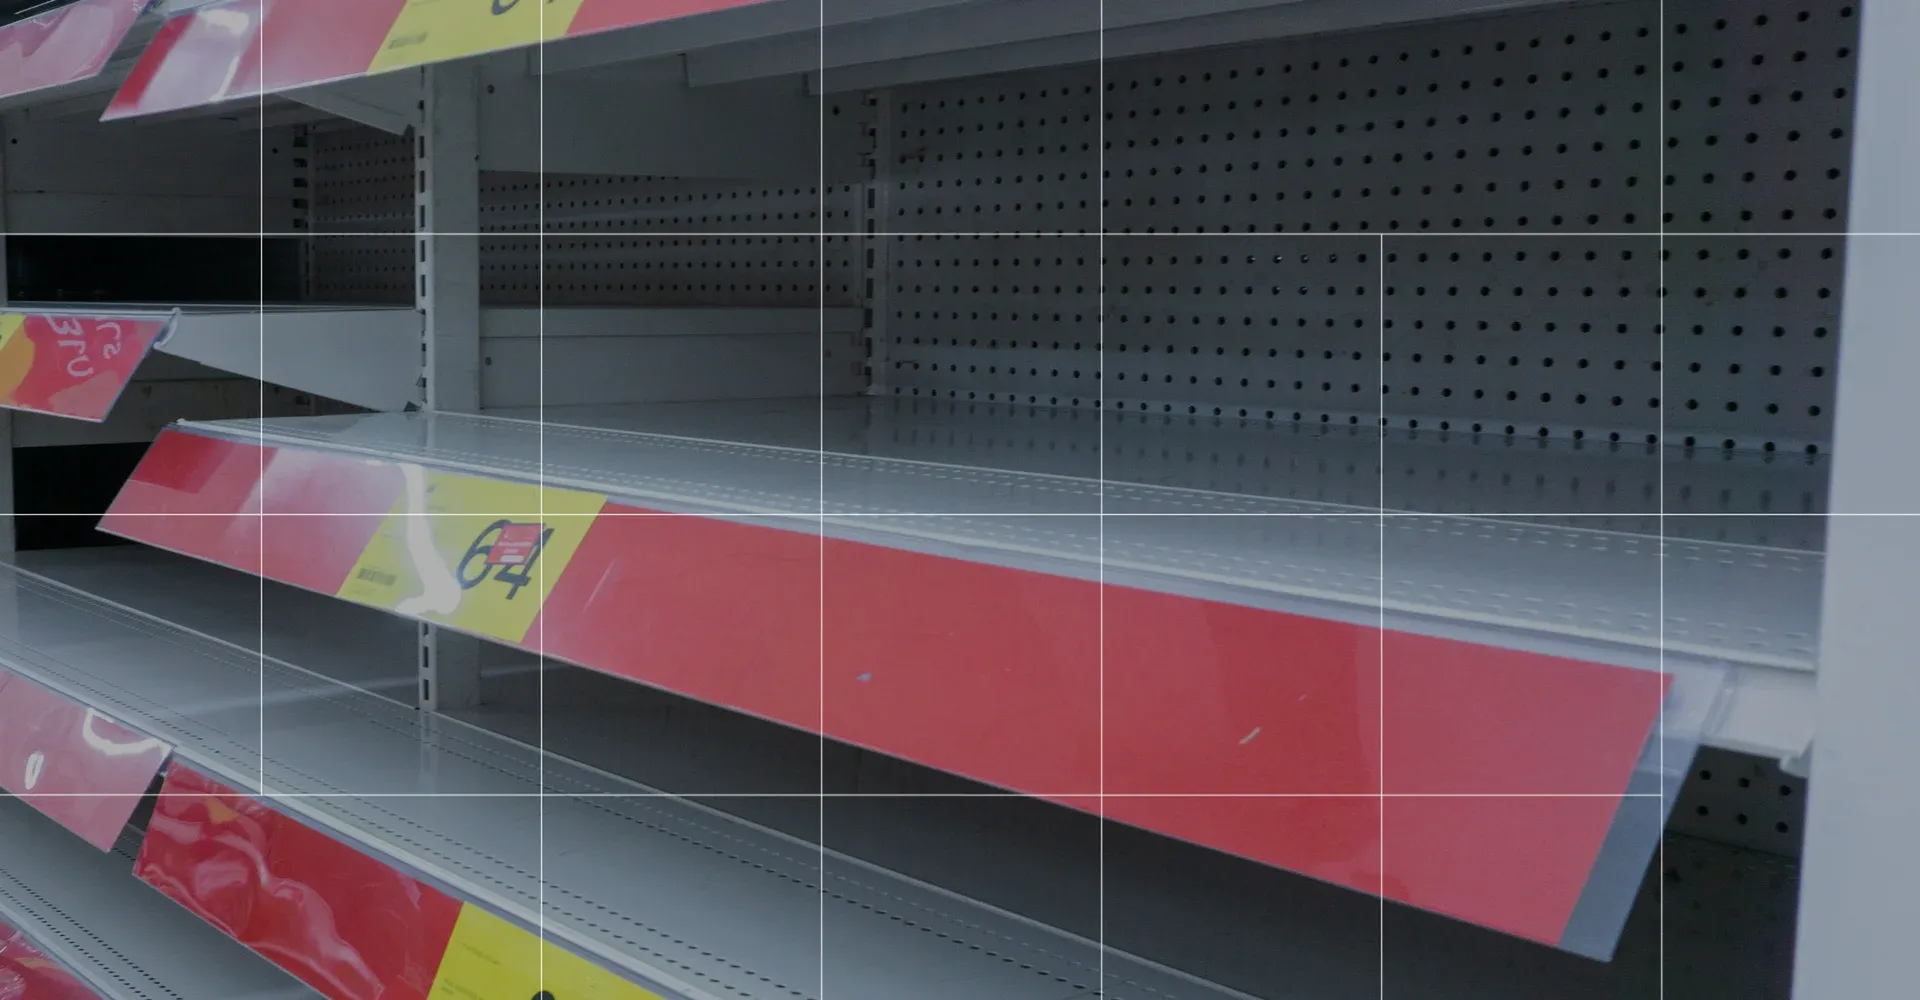
Planogram compliance is the degree to which a store’s actual shelf matches the planned shelf. This means having the right products, in the right positions, with the right number of facings. It is usually expressed as a percentage across a store estate, and it is one of the most reliable predictors of whether a category plan delivers the sales it was designed to.
Why compliance moves the numbers
A planogram is a set of decisions about how a category makes money - which products earn space, where shopper attention lands, how the range architecture guides a purchase. Every store that deviates from the plan is quietly running a different, untested version of those decisions.
The costs come in three forms.
Availability. The most common compliance failure is a product missing from its planned position or absent altogether. A shopper who cannot find the product buys a substitute or nothing, and the sale rarely comes back.
Position. A product merchandised in the wrong bay or at the wrong height performs like a different product. The plan’s assumptions about visibility and flow stop applying the moment the layout drifts.
Measurement. When you evaluate a range change against sales data, you are assuming stores executed the change. If a third of them did not, your read on what worked is contaminated, and the next plan is built on a false result.
What poor compliance looks like in practice
Two examples from Vazen’s own client work show the scale hiding in this problem.
A beer brand had one SKU sitting on the wrong shelf, a single execution error, replicated across nearly 30% of a retailer’s estate. Nobody could see it, because nobody had store-level visibility of the shelf. Once the pattern was visible in the planogram data, the fix took days and availability was restored across almost a third of stores. The full story is in our results.
Red Bull’s field team faced the opposite problem: plenty of stores to visit and no way to know which ones needed attention. Reps were shelf-checking blind. With store-level planogram visibility and target lists, they walked into stores already knowing what to fix. Compliance rose 7% and category sales rose 5% behind it. That story is in the Red Bull case study.
The pattern in both is that the compliance problem was invisible until the shelf data made it visible, and cheap to fix once it was.
How planogram compliance is measured
Compliance measurement compares the planned shelf against evidence of the actual shelf. In practice there are three sources of that evidence, in ascending order of scale.
Physical audits. A person stands in front of the fixture with the plan. Accurate for that store on that day, impossible to scale, and out of date by the following week.
Crowdsourced or field-team checks. Broader coverage, still sampled, still periodic.
Continuous planogram data. Where a retailer shares store-level planogram data, compliance can be assessed across the whole estate continuously, and deviations surface as they happen rather than when someone happens to visit. This is the approach Coplan takes, live with Tesco and Co-op today: continuous shelf and planogram data across the entire retailer estate, so a brand can see every store’s shelf without leaving the desk.
Compliance is a shared problem, and that is the opportunity
Brands often treat compliance as something that happens to them, and retailers as an operational chore. It is more useful to treat it as the cheapest category growth available to both sides.
Unlike a range change or a promotion, fixing compliance requires no new products, no price investment and no shopper behaviour change. The plan already exists and was already agreed. Execution is the only gap, and closing it converts work both sides have already done into sales both sides share. That is why compliance conversations, backed by store-level evidence rather than anecdote, tend to be the easiest meetings a category manager has all year.
Where to start
Three questions establish whether compliance is costing you growth.
- Can you see your actual shelf across the estate, or only the plan? If the answer is only the plan, every compliance estimate you hold is a guess.
- When did you last find an execution error before it showed up in sales? Finding problems in the sales line means finding them months late.
- When you evaluated your last range change, did you check which stores executed it before reading the results? If the answer is no, the results deserve a second look.
If any of those answers is uncomfortable, bring us your category and we will show you what your shelves actually look like.
Frequently asked questions
What is a good planogram compliance rate?
It varies by category and retailer, but the more useful question is directional: is yours measured, and is it improving? Estates that begin measuring continuously typically find compliance meaningfully lower than assumed, which is exactly why measuring it is worth doing.
Whose job is planogram compliance, the brand’s or the retailer’s?
Execution happens in the retailer’s stores, but the commercial interest is shared, and increasingly so is the data. The most effective model we see is a brand using store-level shelf visibility to direct its own field resource to the stores that need it, which helps the retailer’s execution rather than complaining about it.
Can compliance be measured without store visits?
Yes, where store-level planogram data is available. That is the shift continuous shelf data enables: compliance becomes something you monitor, like sales, rather than something you sample, like an audit.